


The evaluation of the possibility of the estimation the amount of hemagglutininin in the final lots of inactivated adjuvanted influenza vaccines
- Authors: Butirskiy A.Y.1, Morozova E.N.1, Sarkisyan K.A.1
-
Affiliations:
- Scientific Center for Expert Evaluation of Medicinal Products
- Issue: Vol 70, No 1 (2025)
- Pages: 57-65
- Section: ORIGINAL RESEARCHES
- URL: https://virusjour.crie.ru/jour/article/view/16708
- DOI: https://doi.org/10.36233/0507-4088-286
- EDN: https://elibrary.ru/itvlmz
- ID: 16708

Cite item

Abstract
Introduction. The main quality indicator for inactivated influenza vaccines is their potency (the amount of hemagglutinin). The potency test for the influenza vaccine with the SOVIDON adjuvant is carried out in a trivalent bulk vaccine before the addition of the adjuvant. This approach has its fair share of drawbacks. The analysis of the statistical process control and stability by control charts plays an important role in the release of influenza vaccines.
The aim of the study is to compare the results of hemagglutinin quanitation in the trivalent bulk vaccine and in the final lots of influenza vaccine with SOVIDON adjuvant; as well as the analysis of the potency test results to evaluate the statistical process control.
Materials and methods. This study covered the inactivated influenza vaccine with the SOVIDON adjuvant. Both the trivalent bulks vaccine before the addition of the adjuvant and the final lots were investigated by single radial immunodiffusion assay. The software SIAMS Photolab was used to calculate the amount of hemagglutinin. Microsoft Excel was used to create the control charts using the data of the manufacturer.
Results. The data of the study confirm the absence of statistically significant differences (p < 0.05) of the content of hemagglutinin in the trivalent bulks and the final lots of the influenza vaccine. The analysis of control charts showed the presence of out-of-control signals.
Conclusion. The study has shown the possibility and feasibility of the potency testing of the influenza vaccine with the SOVIDON adjuvant. The presence of out-of-control signals on the control charts is the basis for the identification of the reasons behind the changes and for the analysis of risks of the release of a defective influenza vaccine.
Full Text
Introduction
Influenza currently remains an infectious disease of particular importance for practical public health. According to Rospotrebnadzor, the incidence of influenza for the period 2017–2021 ranged from 14.96 (2021) to 37.31 (2019) cases per 100 thousand population, and in the last 2 years a sharp rise was registered: 60.8 and 166.94 cases per 100 thousand population in 2022–2023, respectively [1]. The economic damage in the Russian Federation in 2023 from influenza amounted to 9,813,451.4 thousand rubles1. First of all, the epidemiological and social significance of influenza is determined by the high contagiousness of the infection, the wide susceptibility of the population to the pathogen, the significant frequency of complications in patients from the most vulnerable strata (children under 14 years of age, patients over 65 years of age, pregnant women, patients with pulmonary and cardiovascular chronic diseases). In this regard, the annual all-Russian influenza vaccination campaign is the most important activity that has shown high effectiveness for the management of influenza infection. It has been established that vaccination where the influenza vaccine matches with the circulating strain reduces the incidence of influenza by 90%, other acute respiratory viral infections – by 56%, the number of hospitalizations associated with complications after the disease – by 48% [2]. Taking into account the recommendations of the World Health Organization, the coverage of influenza vaccination in risk groups should be at least 75%; the coverage of influenza vaccination of the population as a whole in the country and in the constituent entities of the Russian Federation separately – at least 45%2. Over the last 5 years, the number of vaccinated people annually fluctuated within 69,122,430–85,898,810 (abs. values). The rise in morbidity in the last 2 years is noteworthy, despite the fact that vaccination coverage has not decreased since 2021, when the lowest level of morbidity for the recent decade was registered. Under these conditions, the release of influenza vaccines into civilian circulation that meet all quality indicators requires close attention. The main quality indicator ensuring preventive efficacy of influenza vaccines is their potency. This indicator is characterized by the quantitative content of hemagglutinins of influenza virus subtypes and types relevant for the current epidemic season and included in the vaccine. In addition to the generally accepted classification of influenza vaccines, depending on the type of production (whole-virion, split, subunit vaccines), domestic vaccines can be classified by the composition of adjuvants: adjuvant-containing and non-adjuvant-containing vaccines.
The adjuvanted influenza vaccines currently registered in the Russian Federation contain one of two possible adjuvants: azoximera bromide or SOVIDON.
In accordance with the requirements of the State Pharmacopoeia of the Russian Federation3, the method of single radial immunodiffusion (SRID), proposed by J.M. Wood et al. and introduced in 1978 into the routine practice of vaccine control, is used to control the quality indicator – potency – of influenza prophylaxis vaccines [3, 4]. An important condition for obtaining reliable test results is the formation of precipitation rings on the plate in the wells with the test sample that are comparable in characteristics (clarity of boundaries, diameter of rings) to the precipitation rings in the wells with the standard sample. Depending on the composition of the influenza vaccine, the adjuvant in the vaccine may change the appearance of the precipitation rings, which in turn may affect the accuracy of the measurement of the diameter of the precipitation zones. For example, when determining the amount of hemagglutinin in a finished vaccine containing azoximera bromide adjuvant, the formed precipitation rings are characterized by a blurred contour that blends with the internal background, which does not allow to correctly set the reading boundaries and obtain reliable test results. It should be noted that the manufacturer shows the possibility of controlling the indicator in the final lot, but the proposed method provides special conditions for washing the plates with agarose and increases the test time by several days.
In 2012, a domestic influenza vaccine containing the SOVIDON adjuvant was registered [5]. In accordance with the current regulatory documentation for the drug release quality control for potency is carried out on samples of semi-finished product (subunit trivaccine before the addition of adjuvant). A significant disadvantage of using a semi-finished product as a test object is its short shelf life (from 3 to 6 months), which limits its use for studying the stability of influenza vaccines during the shelf life of the finished dosage form or when investigating complaints from sites of use. The amount of hemagglutinin in the finished dosage form is determined by calculation: by multiplying the value obtained in the semi-finished product by a certain coefficient depending on the amount of adjuvant added. However, this approach does not take into account the possibility of irregularities in the production process during the adjuvant addition and subsequent steps, which may affect the actual hemagglutinin content of the finished product. In this regard, it is preferable to perform the potency test on samples of the finished dosage form [6].
In recent years, the ideology of «pharmaceutical quality system» (PQS), presented for the first time at the International Council for Harmonization of Technical Requirements for Pharmaceuticals for Human Use (ICH) in Brussels, has been increasingly recognized. To date, 4 main elements of PQS are distinguished: 1) monitoring of processes and product quality; 2) system of corrective and preventive actions; 3) change management; 4) management analysis [7]. One of the illustrative tools for assessing the quality of vaccines for influenza prevention released into civil circulation is the assessment of statistical controllability of the production process by constructing and analyzing Shewhart control charts. It is known that the production process is at an acceptable and stable level, allowing to ensure compliance of the product quality with the regulated requirements, if its variability is due to random causes, acting constantly and difficult to detect. Timely detection of deviations from the established control limits allows to immediately analyze production risks and prevent the release of poor-quality vaccine [8, 9].
The aim of this study is to evaluate the comparability of the results of hemagglutinin quantitation in the semi-finished vaccine and in the final lot, to analyze the results of quality control of the potency indicator according to passport data to assess the statistical controllability of the production process using Shewhart control charts.
Materials and methods
31 series of semi-finished products (trivaccines before the addition of Sovidon adjuvant) and their corresponding series of finished dosage forms of influenza vaccine containing Sovidon adjuvant were used as study objects. The standard samples used in this study were provided by the regulatory documentation for the tested vaccine and characterized by the quantitative content of hemagglutinin of the corresponding influenza virus strains: subtype A/Victoria/4897/2022 (IVR-238) (H1N1), subtype A/Thailand/8/2022 (H3N2) IVR-237, type B/Austria/1359417/2021 (BVR-26) (Victoria lineage). Standard sera containing antibodies to hemagglutinin of influenza virus subtypes A(H1N1), A(H3N2) and type B homologous to standard antigens were used as standard samples (sera).
The tests were carried out by the SRID method in accordance with the methodology set forth in the regulatory documentation for the drug product. The main steps of the method included: 1) preparation of plates with 1.5% agarose containing appropriate standard serum; 2) mixing of test samples with detergent and incubation for at least 30 min at room temperature; 3) preparation of dilutions of test samples with buffer solution in the ratio of 1 : 0, 3 : 1, 1 : 1, 1 : 3; 4) application of dilutions of test samples in the volume of 20 µl into wells of agarose plate; 5) incubation of plates for at least 18 h in a humid chamber at 20 ± 5 °C; 6) staining of plates with subsequent washing off of excess dye until the precipitation lines appear; 7) recording of results using SIAMS Photolab software.
Statistical processing of the study results was performed using StatPlus software (version 7). Normality of distribution was assessed by the Shapiro–Wilk test, and the Levene’s test was used to assess the equality of dispersions in the compared groups. Statistical significance of differences in groups with normal distribution of data was determined by Student’s criterion (t-test for two independent samples) at a significance level of p < 0.05; while in groups with abnormal distribution of data, it was determined by the Mann–Whitney test at a significance level of p < 0.05.
The construction of Shewhart control charts was performed in the Microsoft Excel program, one point on the graph corresponds to the quantitative hemagglutinin content in 1 series of the drug according to the manufacturer’s data. To calculate the upper (UCL) and lower (LCL) control limits, values of the standard deviation of the process (σ) were guided by generally accepted requirements4.
The requirements of GOST R ISO 7870-2-2015 stipulate the use of 8 criteria to assess the statistical controllability of the production process:
- criterion 1 – one point outside zone A;
- criterion 2 – 9 consecutive points in zone C or on the same side of the center line;
- criterion 3 – 6 increasing or decreasing points in a row;
- criterion 4 – 14 alternately increasing and decreasing points;
- criterion 5 – 2 out of 3 consecutive points in zone A;
- criterion 6 – 4 out of 5 consecutive points in or out of zone B;
- criterion 7 – 15 consecutive points in zone C, above or below the center line;
- criterion 8 – 8 consecutive points on either side of the centerline and none in zone C.
Criteria 1, 2, 3, 7 were regarded as critical, criteria 4, 5, 6, 8 – as preventive.
Results
When considering the results, attention was paid to the visual characteristics of the precipitation rings formed around the wells with the applied samples. The main criteria for acceptability of the results at the stage of visual analysis were: comparability of the precipitation rings obtained when the trivaccine samples (reference standard) and the drug samples were added to the wells of the plates; correspondence of the intensity of the precipitation rings for the tested samples to the intensity of the precipitation rings for the standard samples (antigens); absence of double precipitation rings in all wells of the plate. The precipitation rings formed by the interaction of the standard serum with the antigen contained in the trivaccine and the standard antigen were used as a reference standard. Particular attention was paid to the intensity of the rings and the clarity of their boundaries.
If the mentioned above criteria were met, we plotted the squares of the diameters of the precipitation rings against the dilutions of the test sample/standard sample (antigen) and calculated the quantitative hemagglutinin content of the samples using specialized software. The graphs are straight lines plotted using the least squares method. At this stage, the criteria of acceptability of the test results were taken into account: no intersection of the graphs constructed for the standard sample and the test sample; the distance between the initial points of the graphs (dilution 1 : 3) is no more than 3 mm2. For recalculation in the finished drug product, the obtained hemagglutinin content in the trivaccine was multiplied by 0.9 (a coefficient representing the quotient obtained from dividing the volume of the trivaccine series before the addition of adjuvant (ml) by the volume of the vaccine series after the addition of adjuvant).
The obtained data were evaluated for normality of distribution using the Shapiro–Wilk criterion (Table 1). If the significance level (p) > 0.05, the distribution was considered normal.
Table 1. Evaluation for normality of distribution of hemagglutinin content in test samples
Таблица 1. Оценка нормальности распределения значений, характеризующих содержание гемагглютининов вируса гриппа в испытуемых образцах
Group No. № группы | Test sample Объект испытания | Vaccine strain Вакцинный штамм | Mean value Среднее значение | Shapiro–Wilk criterion (W) Критерий Шапиро–Уилка (W) | р | Normality of distribution Характер распределения |
1 | Trivaccine Тривакцина | A/Victoria (H1N1) | 5.205 (n = 31) | 0.948 | 0.141 | Normal Нормальный |
2 | Drug Лекарственный препарат | A/Victoria (H1N1) | 5.186 (n = 31) | 0.961 | 0.312 | Normal Нормальный |
3 | Trivaccine Тривакцина | A/Thailand (H3N2) | 5.539 (n = 31) | 0.902 | 0.008 | Abnormal Ненормальный |
4 | Drug Лекарственный препарат | A/Thailand (H3N2) | 5.542 (n = 31) | 0.927 | 0.037 | Abnormal Ненормальный |
5 | Trivaccine Тривакцина | B/Austria | 11.185 (n = 30) | 0.962 | 0.345 | Normal Нормальный |
6 | Drug Лекарственный препарат | B/Austria | 11.160 (n = 30) | 0.958 | 0.268 | Normal Нормальный |
To study the possibility of hemagglutinin content quantitation in samples of the final lot of influenza prophylaxis vaccine, a statistical assessment of the reliability of differences in pairwise compared groups (trivaccine/final lot) was performed. The results are presented in Tables 2 and 3. Conclusions about the reliability of differences were made according to the level of significance: if p > 0.05, then there are no differences in the compared groups.
Table 2. The evaluation of hemagglutinin content in test samples (strain A/Victoria (H1N1), strain B/Austria) by t-test (Student test)
Таблица 2. Оценка достоверности различий содержания гемагглютинина в сериях тривакцины и лекарственного препарата для штаммов вирусов гриппа A/Victoria (H1N1), B/Austria с использованием критерия Стьюдента
Group No. № групп | Mean (trivaccine) Среднее (тривакцина) | Mean (final lot) Среднее (лекарственный препарат) | Student test (t) Критерий Стьюдента (t) | р | Conclusion on the reliability of differences Вывод о достоверности различий |
1, 2 | 5.205 | 5.186 | 0.189 | 0.851 | None Отсутствуют |
5, 6 | 11.185 | 11.160 | 0.108 | 0.914 | None Отсутствуют |
Table 3. The evaluation of hemagglutinin content in test samples (strain A/Thailand (H3N2)) by Mann–Whitney U test
Таблица 3. Оценка достоверности различий содержания гемагглютинина в сериях тривакцины и лекарственного препарата для штамма вируса гриппа A/Thailand (H3N2) с использованием критерия Манна–Уитни
Group No. № группы | Rank total (trivaccine) Сумма рангов (тривакцина) | Rank total (final lot) Сумма рангов (лекарственный препарат) | Mann–Whitney U test (U) Критерий Манна–Уитни (U) | р | Conclusion on the reliability of differences Вывод о достоверности различий |
3, 4 | 1010.5 | 942.5 | 446.5 | 0.632 | None Отсутствуют |
The results of the statistical analysis of the experimental data showed that in 2 cases the groups compared in pairs (groups 1 and 2, 5 and 6) had normal distribution and in 1 case (groups 3 and 4) – abnormal distribution, which caused a different choice of statistical criteria for evaluating the differences between 2 independent samples: Student’s t-test for normal distribution and Mann–Whitney test for non-normal distribution. The analysis demonstrated that in all cases there were no statistically significant differences in all pairwise compared groups.
The results of the statistical process control analysis of the influenza vaccine production are presented in Figures 1–3.

Fig. 1. The Control chart for evaluation of stability of the influenza vaccine production (the content of influenza virus strain A(H1N1) hemagglutinin in final lots of the vaccine).
Description in the text.
Рис. 1. Контрольная карта оценки стабильности производственного процесса вакцины для профилактики гриппа по результатам определения количественного содержания гемагглютинина вируса гриппа подтипа A(H1N1) в сериях вакцины.
Описание в тексте.

Fig. 2. The Control chart for evaluation of stability of the influenza vaccine production (the content of influenza virus strain A(H3N2) hemagglutinin in final lots of the vaccine).
Description in the text.
Рис. 2. Контрольная карта оценки стабильности производственного процесса вакцины для профилактики гриппа по результатам определения количественного содержания гемагглютинина вируса гриппа подтипа A(H3N2) в сериях вакцины.
Описание в тексте.

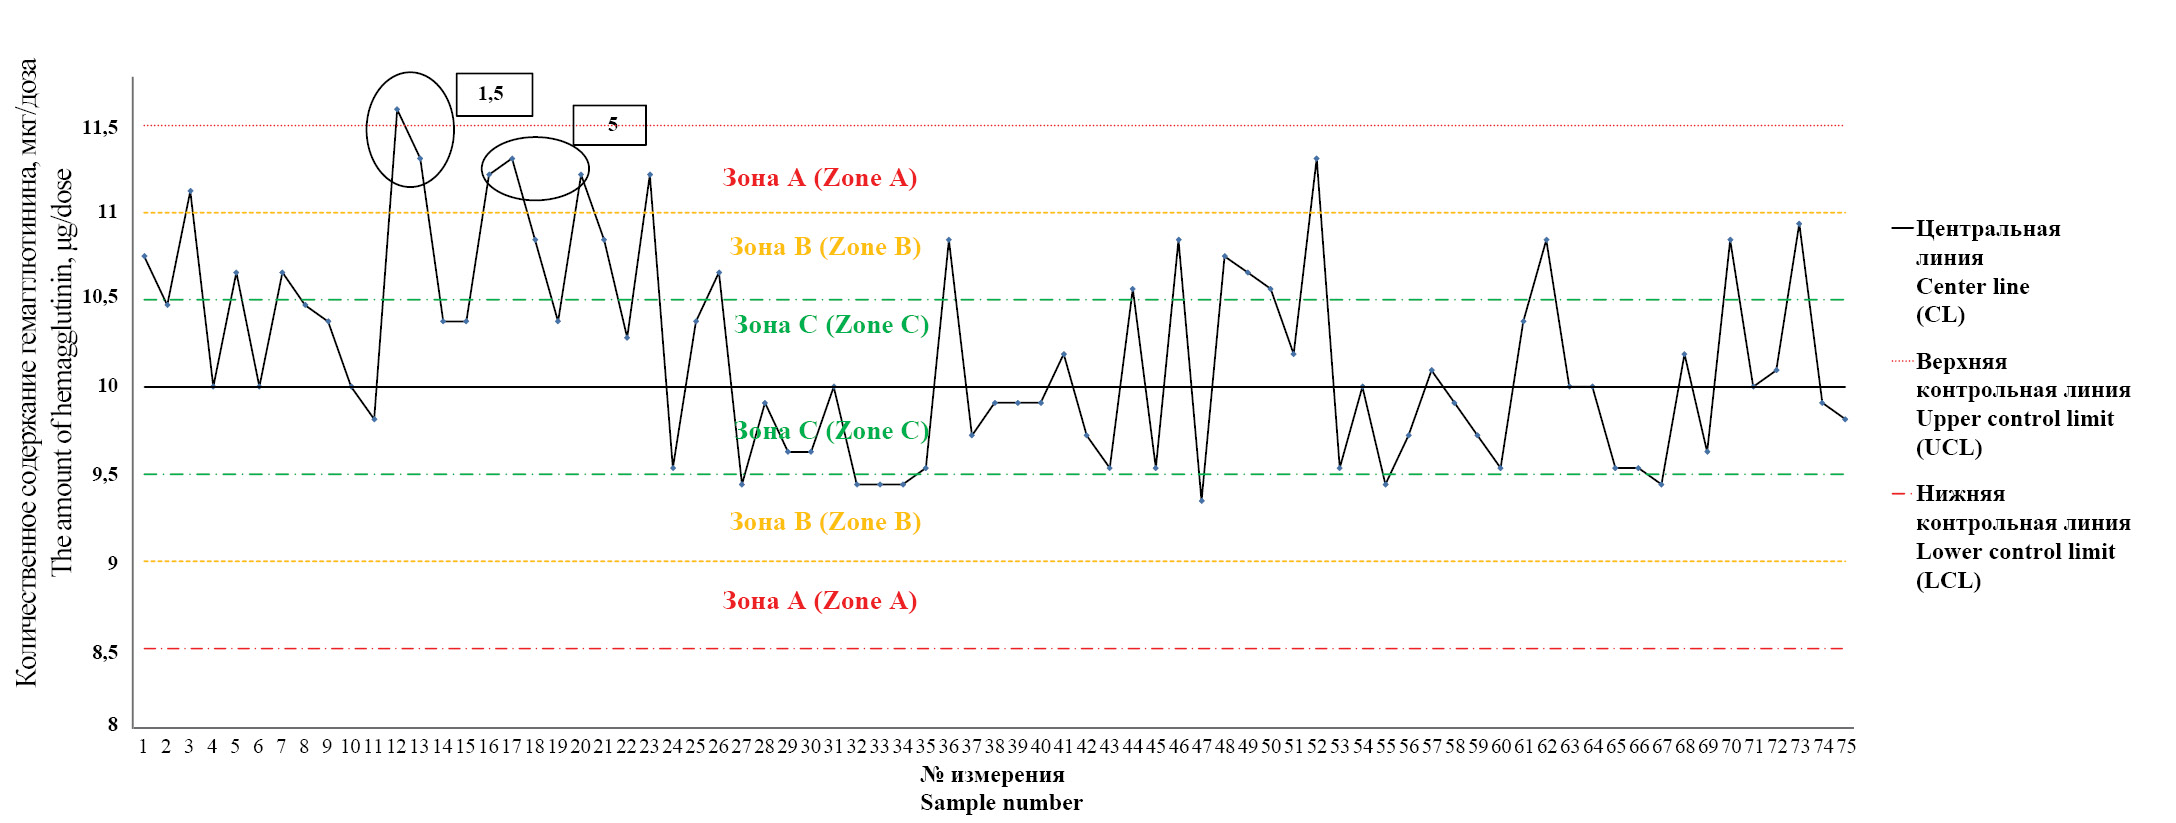
Fig. 3. The Control chart for evaluation of stability of the influenza vaccine production (the content of influenza virus strain B hemagglutinin in final lots of the vaccine).
Description in the text.
Рис. 3. Контрольная карта оценки стабильности производственного процесса вакцины для профилактики гриппа по результатам определения количественного содержания гемагглютинина вируса гриппа типа В в сериях вакцины.
Описание в тексте.
The Y-axis of each graph shows the values of hemagglutinin content in micrograms per 1 dose of the final lot (µg/dose), while the X-axis shows the number of measurements. To analyze the obtained data, the central line (CL) corresponding to the average value of the obtained measurements and 3 additional lines on each side of the central line corresponding to the calculated values ±1σ, ±2σ, ±3σ (UCL – upper control line, LCL – lower control line) are drawn on each graph. The zones bounded by the center line and the lines ±1σ, ±2σ, ±3σ are labeled «zone C», «zone B», «zone A», respectively. In case of detection of the features corresponding to the criteria from the «Materials and Methods» section, the number of the criterion was indicated on the graph.
In all measurements, the specific activity of influenza vaccine series met the requirements of the regulatory documentation: for subtypes A (H1N1) and A (H3N2) – from 4.0 to 6.0 µg/dose, for type B – from 9.0 to 13.0 µg/dose.
Fig. 1 shows that there are no criteria signaling the impact of special (external) causes not peculiar to the production process. However, attention is drawn to the fact that in 3 cases (measurements 11, 28, 37) there is a tendency to form criterion 5, in 1 case (measurements 59–64) – criterion 3 and in 1 case (measurement 64) – criterion 1. In the latter case, measurement 64 reaches the value (5.6 µg per dose) set for the upper reference limit, without going beyond zone A.
In Fig. 2, criteria signaling the action of special (external) causes are also absent. However, in 2 cases (measurements 18, 28) there is a tendency to form critical criterion 1: the measurements reach the value (5.9) set for the upper control limit, not going beyond zone A, but approaching the upper limit of the normative hemagglutinin content in the vaccine (6.0 µg hemagglutinin per dose).
Fig. 3 shows that in 1 case criterion 1 (measurement 12) was established, in 2 cases – criterion 5 (measurements 16, 17), there is a tendency to form criterion 3 (measurements 7–11).
Discussion
When planning the test, we considered the hypothesis that SOVIDON adjuvant contained in the vaccine may change the standard appearance of the precipitation rings, impair the quality of plate washing from the dye, reduce the contrast of the precipitation rings in relation to the agarose gel and, as a consequence, lead to incorrect measurement of the squares of dimeters and, consequently, to unreliable results.
When considering the test results, the precipitation rings formed by the interaction of the standard serum with the antigen contained in the trivaccine and the standard antigen were used as a reference standard. Particular attention was paid to the intensity of the rings and the clarity of their boundaries.
Comparative analysis of the visual characteristics of the precipitation rings showed that the rings formed by the vaccine with adjuvant did not differ from those of the reference standards. No additional treatment of the plates by immersion in buffer solution and washing of non-specific components was required. It was shown that the acceptance criteria for the visual evaluation stage of the results were met for each study subject regardless of the influenza virus vaccine strain included in the vaccine and the adjuvant content of the final lot (0.8 to 1.2 mg/mL).
During calculations in the SIAMS Photolab program, we analyzed the graphs of linear dependence of the squares of the diameters of the precipitation rings on the dilutions of the vaccine samples with adjuvant. For all observations, it was found that the diameter of the precipitation rings decreased in the series of vaccine dilutions: 1 : 0–3 : 1–1 : 1–1 : 1–1 : 3, with the coefficient of determination (R2) ranging from 0.900–0.998. It was found that the acceptance criteria for the graphs were also met in all cases: the graphs constructed for the test samples and standard antigens did not overlap, the starting points of the graphs were within 3 mm2 of each other.
It is shown that the SOVIDON adjuvant does not affect the reliability of quantitative hemagglutinin content determination in the finished dosage form by the SRID method. Thus, the change of the test object in conducting studies to confirm the conformity of influenza vaccines with adjuvant released into civil circulation will allow control of the potency indicator by direct measurement of the amount of hemagglutinin, rather than by calculation. This fact is of particular importance, because the control of the finished dosage form allows to detect discrepancies in the potency indicator in case of the impact of negative external factors on the drug from the moment of release of the drug by the manufacturer and up to the moment of its receipt in the testing laboratory. Furthermore, the possibilities to investigate the stability of the final lot, whose shelf life (12 months) exceeds the shelf life of the semi-finished product (3 months), and to study the quality of the vaccine in case of investigation of complaints from the places of application of influenza vaccine are expanding.
The analysis of the constructed control charts allows us to conclude that there are special causes affecting the production process. The control map presented in Fig. 3 draws attention to them. The identified criterion 1 belongs to the critical type and may signal the need to influence the production process itself. The seriousness of the situation is emphasized by the fact that criterion 5 is registered in close proximity to the detected criterion and there is a tendency to go beyond the control upper limit for two points on the chart (measurements 20, 23). Subsequently, the production process returns to the state of statistical controllability, but measurement 52 already approaches the upper control boundary. In this situation, we can speak about a high probability of a decrease in the degree of stability of the production process of influenza vaccine.
On the control map presented in Fig. 1, the formed criteria of instability of the production process are absent, but 5 measurements are registered to zone A, and one of the points has reached the upper control boundary without going beyond it. The situation presented in the figure may indicate an increase in the risk of the production process leaving the state of statistical control.
Evaluation of the data shown in Fig. 2 shows the occurrence of criterion 5 twice. Although this criterion belongs to the type of warning criteria that do not require impact on the production process, the control chart records 2 cases of reaching the upper control limit and 2 cases of measurements entering Zone A. It should be noted that the measurements reach the upper control point in close proximity to the first criterion 5 (points 6–14).
In summary, we can distinguish 2 approaches in the case of registering the criteria of instability of the production process depending on the type of criteria detected. Obtaining a result outside the control boundary (zone A) indicates that the production process may be uncontrollable. The control chart in this case signals that a special cause of variability may be present and the process should be affected in some way, such as analyzing the data to determine the sources of the special cause in order to eliminate and reduce the influence of the special cause in the future; adjusting the production process; stopping the production process and taking corrective actions [10].
If the measurement results are outside the warning limits (±2σ) but within the control limits, it is appropriate to look for the presence or absence of a special cause, even though no impact on the process is required.
Conclusion
The feasibility of hemagglutinin content quantitation in the finished dosage form of influenza vaccine containing the SOVIDON adjuvant is shown and substantiated.
The revealed trends in the analysis of Shewhart control charts are the basis for determining the cause of the production process of influenza vaccine out of the state of statistical controllability and analyzing the risks of release into civil circulation of vaccine series that do not meet the established requirements.
1 State report «On the state of sanitary and epidemiological welfare of the population in the Russian Federation in 2023». Moscow; 2024. (in Russian)
2 SanPiN 3.3686–21. Sanitary and epidemiological requirements for the prevention of infectious diseases. Moscow; 2021. (in Russian)
3 «FS.3.3.1.0028.20. Pharmacopoeial article. Inactivated influenza vaccine» (approved and put into effect by Order of the Ministry of Health of Russia dated 07/28/2020 No. 751)
4 ISO 7870-2:2013. Control charts – Part 2: Shewhart control charts. ISO; 2013.
About the authors
Aleksey Y. Butirskiy
Scientific Center for Expert Evaluation of Medicinal Products
Author for correspondence.
Email: butirskiy@expmed.ru
ORCID iD: 0000-0002-0352-522X
chief expert of viral vaccines laboratory
Russian Federation, 127051, MoscowElena N. Morozova
Scientific Center for Expert Evaluation of Medicinal Products
Email: Morozovaen@expmed.ru
ORCID iD: 0009-0005-0478-1558
expert of viral vaccines laboratory
Russian Federation, 127051, MoscowKarine A. Sarkisyan
Scientific Center for Expert Evaluation of Medicinal Products
Email: Sarkisyan@expmed.ru
ORCID iD: 0000-0003-0445-7086
candidate of medical science, head of viral vaccines laboratory
Russian Federation, 127051, MoscowReferences
- Nikiforov V.V., Polibin R.V., Suranova T.G., Polezhaeva N.A. Flu yesterday, today and tomorrow. The results of monitoring immunization and morbidity in the epidemic seasons 2019–2020, 2020–2021, 2021–2022, 2022–2023. Epidemiologiya i infektsionnye bolezni. 2023; 28(6): 373–86. https://doi.org/10.17816/EID607411 https://elibrary.ru/milthb (in Russian)
- Erofeeva M.K., Stukova M.A., Shakhlanskaya E.V., Buzitskaya Zh.V., Maksakova V.L., Krainova T.I. et al. Evaluation of the preventive effectiveness of influenza vaccines in the epidemic season 2019–2020 in St. Petersburg. Epidemiologiya i vaktsinoprofilaktika. 2021; 20(5): 52–60. https://doi.org/10.31631/2073-3046-2021-20-5-52-60-52-60 https://elibrary.ru/zcbuzk (in Russian)
- Wood JM, Schild GC, Newman RW, Seagroatt V. An improved single-radial-immunodiffusion technique for the assay of influenza haemagglutinin antigen: application for potency determinations of inactivated whole virus and subunit vaccines. J Biol Stand. 1977; 5: 237-247. https://doi.org/10.1016/S0092-1157(77)80008-5.
- John M.Wood, Jerry P.Weir. Standardisation of inactivated influenza vaccines – Learning from history. Influenza Other Respi Viruses. 2018; 12: 195-201. doi: 10.1111/irv.12543. Epub 2018 Feb 2.
- Nikiforova A.N., Isakova-Sivak I.N., Erofeeva M.K., Fel’dblum I.V., Rudenko L.G. The results of studying the Safety and immunogenicity of domestic subunit adjuvanted vaccine Sovigripp in volunteers from 18 to 60 years old. Epidemiologiya i vaktsinoprofilaktika. 2014; (2): 72–8. https://elibrary.ru/sbeunx (in Russian)
- Philip D. Minor. Assaying the Potency of Influenza Vaccines. Vaccines. 2015; 3(1): 90-104. https://doi.org/10.3390/vaccines3010090.
- Khokhlov A.L., Pyatigorskaya N.V., eds. The Industrial Pharmacy. Product Development Cycle [Promyshlennaya farmatsiya. Put’ sozdaniya produkta]. Moscow: Rossiiskaya akademiya nauk; 2019. (in Russian)
- Demidova P.V., Mefed K.M., Davydov D.S., Sarkisyan K.A., Movsesyants A.A., Merkulov V.A. Analysis of batch to batch consistency of a locally produced influenza vaccine for the 2017–2018 influenza season. BIOpreparaty. Profilaktika, diagnostika, lechenie. 2018; 18(2): 121–32. https://doi.org/10.30895/2221-996X-2018-18-2-121-132 https://elibrary.ru/xqrelj (in Russian)
- Alekseeva I.A., Perelygina O.V., Kolyshkina E.D. Estimation of production consistency of diphtheria, tetanus, and pertussis components of the DTP vaccine using Shewhart charts. BIOpreparaty. Profilaktika, diagnostika, lechenie. 2021; 21(4): 256–65. https://doi.org/10.30895/2221-996X-2021-21-4-256-265 https://elibrary.ru/vnsstr (In Russian)
- Wheeler D., Chambers D. Understanding Statistical Process Control. Knoxville, Tennessee: SPC Press; 1992.
Supplementary files

